Air Pollution Index levels scale
Overview
Different countries have their own air quality indices, corresponding to different national air quality
standards. Please find air quality index levels scales used in UK, Europe, USA and Mainland China in the sections
below.
You can get air pollution data for any coordinates on the globe using Air
Pollution API.
Air quality index levels scale in UK
Below is a description of UK Air Quality Index levels:
| Qualitative name | Index | Pollutant concentration in μg/m3 | ||||
|---|---|---|---|---|---|---|
| SO2 | NO2 | PM2.5 | PM10 | O3 | ||
| Low | 1 | 0-88 | 0-67 | 0-11 | 0-16 | 0-33 |
| Low | 2 | 89-177 | 68-134 | 12-23 | 17-33 | 34-66 |
| Low | 3 | 178-266 | 135-200 | 24-35 | 34-50 | 67-100 |
| Moderate | 4 | 267-354 | 201-267 | 36-41 | 52-58 | 101-120 |
| Moderate | 5 | 355-443 | 268-334 | 42-47 | 59-66 | 121-140 |
| Moderate | 6 | 444-532 | 335-400 | 48-53 | 67-75 | 141-160 |
| High | 7 | 533-710 | 401-467 | 54-58 | 76-83 | 161-187 |
| High | 8 | 711-887 | 468-534 | 59-64 | 84-91 | 188-213 |
| High | 9 | 888-1064 | 535-600 | 65-70 | 92-100 | 214-240 |
| Very High | 10 | ⩾1065 | ⩾601 | ⩾71 | ⩾101 | ⩾241 |
Air quality index levels scale in Europe
Below is a description of Europe Air Quality Index levels:
| Qualitative name | Index or sub-index | Pollutant (hourly) concentration in μg/m3 | |||
|---|---|---|---|---|---|
| NO2 | PM10 | O3 | PM2.5 | ||
| Very Low | 0-25 | 0-50 | 0-25 | 0-60 | 0-15 |
| Low | 25-50 | 50-100 | 25-50 | 60-120 | 15-30 |
| Medium | 50-75 | 100-200 | 50-90 | 120-180 | 30-55 |
| High | 75-100 | 200-400 | 90-180 | 180-240 | 55-110 |
| Very high | >100 | >400 | >180 | >240 | >110 |
Air quality index levels scale in USA
Below is a description of USA Air Quality Index levels:
| AQI | Level of health concern | Color |
|---|---|---|
| 0 to 50 | Good | Green |
| 51 to 100 | Moderate | Yellow |
| 101 to 150 | Unhealthy for sensitive groups | Orange |
| 151 - 200 | Unhealthy | Red |
| 201-300 | Very unhealthy | Purple |
| 301-500 | Hazardous | Maroon |
| 501-1000 | Very Hazardous | Brown |
For pollutants concentration recalculation into AQI equation and table below is used:
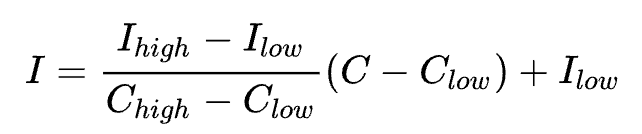
where:
I = the Air Quality index,
C = the pollutant concentration,
Clow= the concentration breakpoint that is ≤C,
Chigh= the concentration breakpoint that is ≥C,
Ilow= the index breakpoint corresponding to Clow,
Ihigh= the index breakpoint corresponding to Chigh.
| Ilow-Ihigh | O3, ppb (8-hr) | O3, ppb (1-hr) | PM2.5, μg/m3 (24-hr) | PM10, μg/m3 (24-hr) | CO, ppm (8-hr) | SO2, ppb | NO2, ppb (1-hr) |
|---|---|---|---|---|---|---|---|
| Сlow-Chigh(avg) | |||||||
| 0-50 | 0-54 | - | 0.0-12.0 | 0-54 | 0.0-4.4 | 0-35 (1-hr) | 0-53 |
| 51-100 | 55-70 | - | 12.1-35.4 | 55-154 | 4.5-9.4 | 36-75 (1-hr) | 54-100 |
| 101-150 | 71-85 | 125-164 | 35.5-55.4 | 155-254 | 9.5-12.4 | 76-185 (1-hr) | 101-360 |
| 151-200 | 86-105 | 165-204 | 55.5-150.4 | 255-354 | 12.5-15.4 | 186-304 (1-hr) | 361-649 |
| 201-300 | 106-200 | 205-404 | 150.5-250.4 | 355-424 | 15.5-30.4 | 305-604 (24-hr) | 650-1249 |
| 301-400 | - | 405-504 | 250.5-350.4 | 425-504 | 30.5-40.4 | 605-804 (24-hr) | 1250-1649 |
| 401-500 | - | 505-604 | 350.5-500.4 | 505-604 | 40.5-50.4 | 805-1004 (24-hr) | 1650-2049 |
Air quality index levels scale in Mainland China
Below is a description of Mainland China Air Quality Index levels:
| AQI | Air pollution level | Air pollution category |
|---|---|---|
| 0-50 | Level 1 | Excellent |
| 51-100 | level 2 | Good |
| 101-150 | Level 3 | Lightly polluted |
| 151-200 | Level 4 | Moderatory polluted |
| 201-300 | Level 5 | Heavily polluted |
| >300 | Level 6 | Severely polluted |
An individual score (Individual Air Quality Index, IAQI) is calculated using formula and table with
breakpoint concentrations below:
where:
I = the Individual Air Quality index,
C = the pollutant concentration,
Clow= the concentration breakpoint that is ≤C,
Chigh= the concentration breakpoint that is ≥C,
Ilow= the index breakpoint corresponding to Clow,
Ihigh= the index breakpoint corresponding to Chigh.
| Individual index | Units are in μg/m3 except CO, which is in mg/m3 | |||||||||
|---|---|---|---|---|---|---|---|---|---|---|
| IAQI | SO2, 24 hour | SO2,1 hour (1) | NO2, 24 hour | NO2, 1 hour (1) | PM10, 24 hour | CO, 24 hour | CO, 1 hour (1) | O3, 1 hour | O3, 8 hour | PM2.5, 24 hour |
| 0 | 0 | 0 | 0 | 0 | 0 | 0 | 0 | 0 | 0 | 0 |
| 50 | 50 | 150 | 40 | 100 | 50 | 2 | 5 | 160 | 100 | 35 |
| 100 | 150 | 500 | 80 | 200 | 150 | 4 | 10 | 200 | 160 | 75 |
| 150 | 475 | 650 | 180 | 700 | 250 | 14 | 35 | 300 | 215 | 115 |
| 200 | 800 | 800 | 280 | 1200 | 350 | 24 | 60 | 400 | 265 | 150 |
| 300 | 1600 | (2) | 565 | 2340 | 420 | 36 | 90 | 800 | 800 | 250 |
| 400 | 2100 | (2) | 750 | 3090 | 500 | 48 | 120 | 1000 | (3) | 350 |
| 500 | 2620 | (2) | 940 | 3840 | 600 | 60 | 150 | 1200 | (3) | 500 |
| Notes | (1) SO2, NO2, CO 1 hour average concentrations are only for real
time reporting. For daily reports use 24 hour average concentration. (2) If the SO2 concentration exceeds 800 μg/m3 use the index from the 24 hour concentration instead. (3) If the O3 concentration exceeds 800 μg/m3 use the index from the 1 hour concentration instead. |
|||||||||